Invoking R from ArcGIS
Statistical analysis is often best conducted from R, be it within an integrated development environment like RStudio or simply from the command line. But from time to time, it is convenient to utilize R from within an ArcGIS geoprocessing workflow. In this example, we’ll cover the basics of how this can be done with MGET’s Evaluate R Expression tool. We also have an example showing how use MGET to invoke R from Python.
To run this example, you must have R installed. We recommend a relatively recent version, but any version from the past few years should work.
Create a project and add MGET
Start ArcGIS Pro and create a new project.
Click Project and go to the Package Manager. Make sure the Active Environment is set to the one that has MGET installed into it. Note that if you change your active environment, you have to restart ArcGIS Pro for it to take effect. For more on activating environments, click here.
Add the MGET toolbox to the project’s list of toolboxes, using the environment you activated above.
Evaluating R expressions
To give the tool a try without setting up a geoprocessing model:
In the geoprocessing pane’s Find Tools box, search for the tool named Evaluate R Expressions and open it.
In the R expressions box, enter
x <- 6and press Enter. Then enter a second expressiony <- 7and a thirdprint(x*y).The tool should look similar to this:
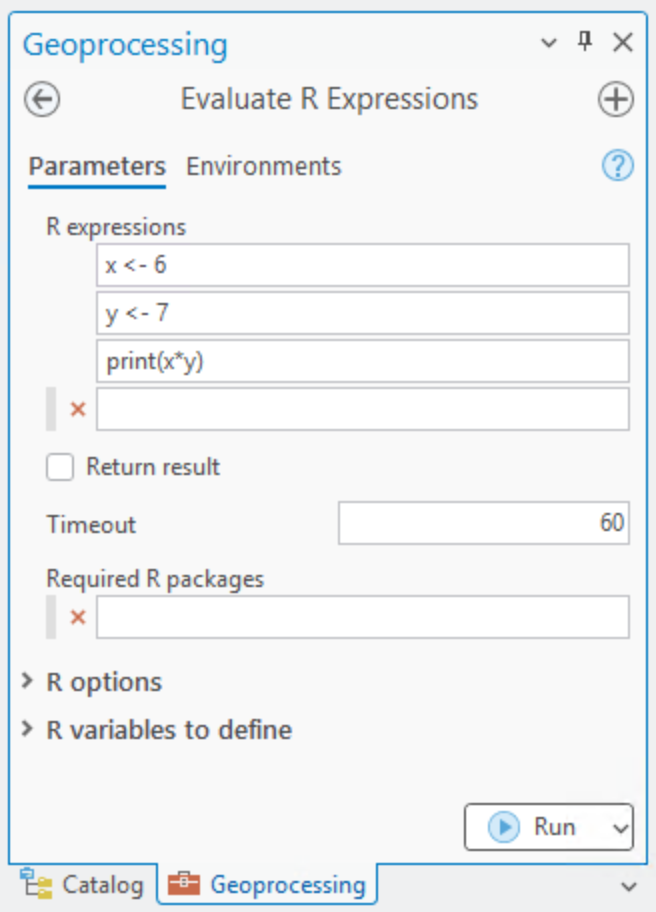
Click Run.
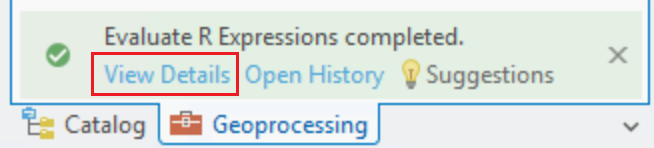
Click View Details. You can click it while the tool is running or after it completes:
The first time you run the tool, it has to install some R packages to allow MGET to communicate with R. (To learn more about how that works, review the documention MGET’s
RWorkerProcessPython class.) This installation will take a few 10s of seconds and the Details window will contain many messages logging which packages were installed: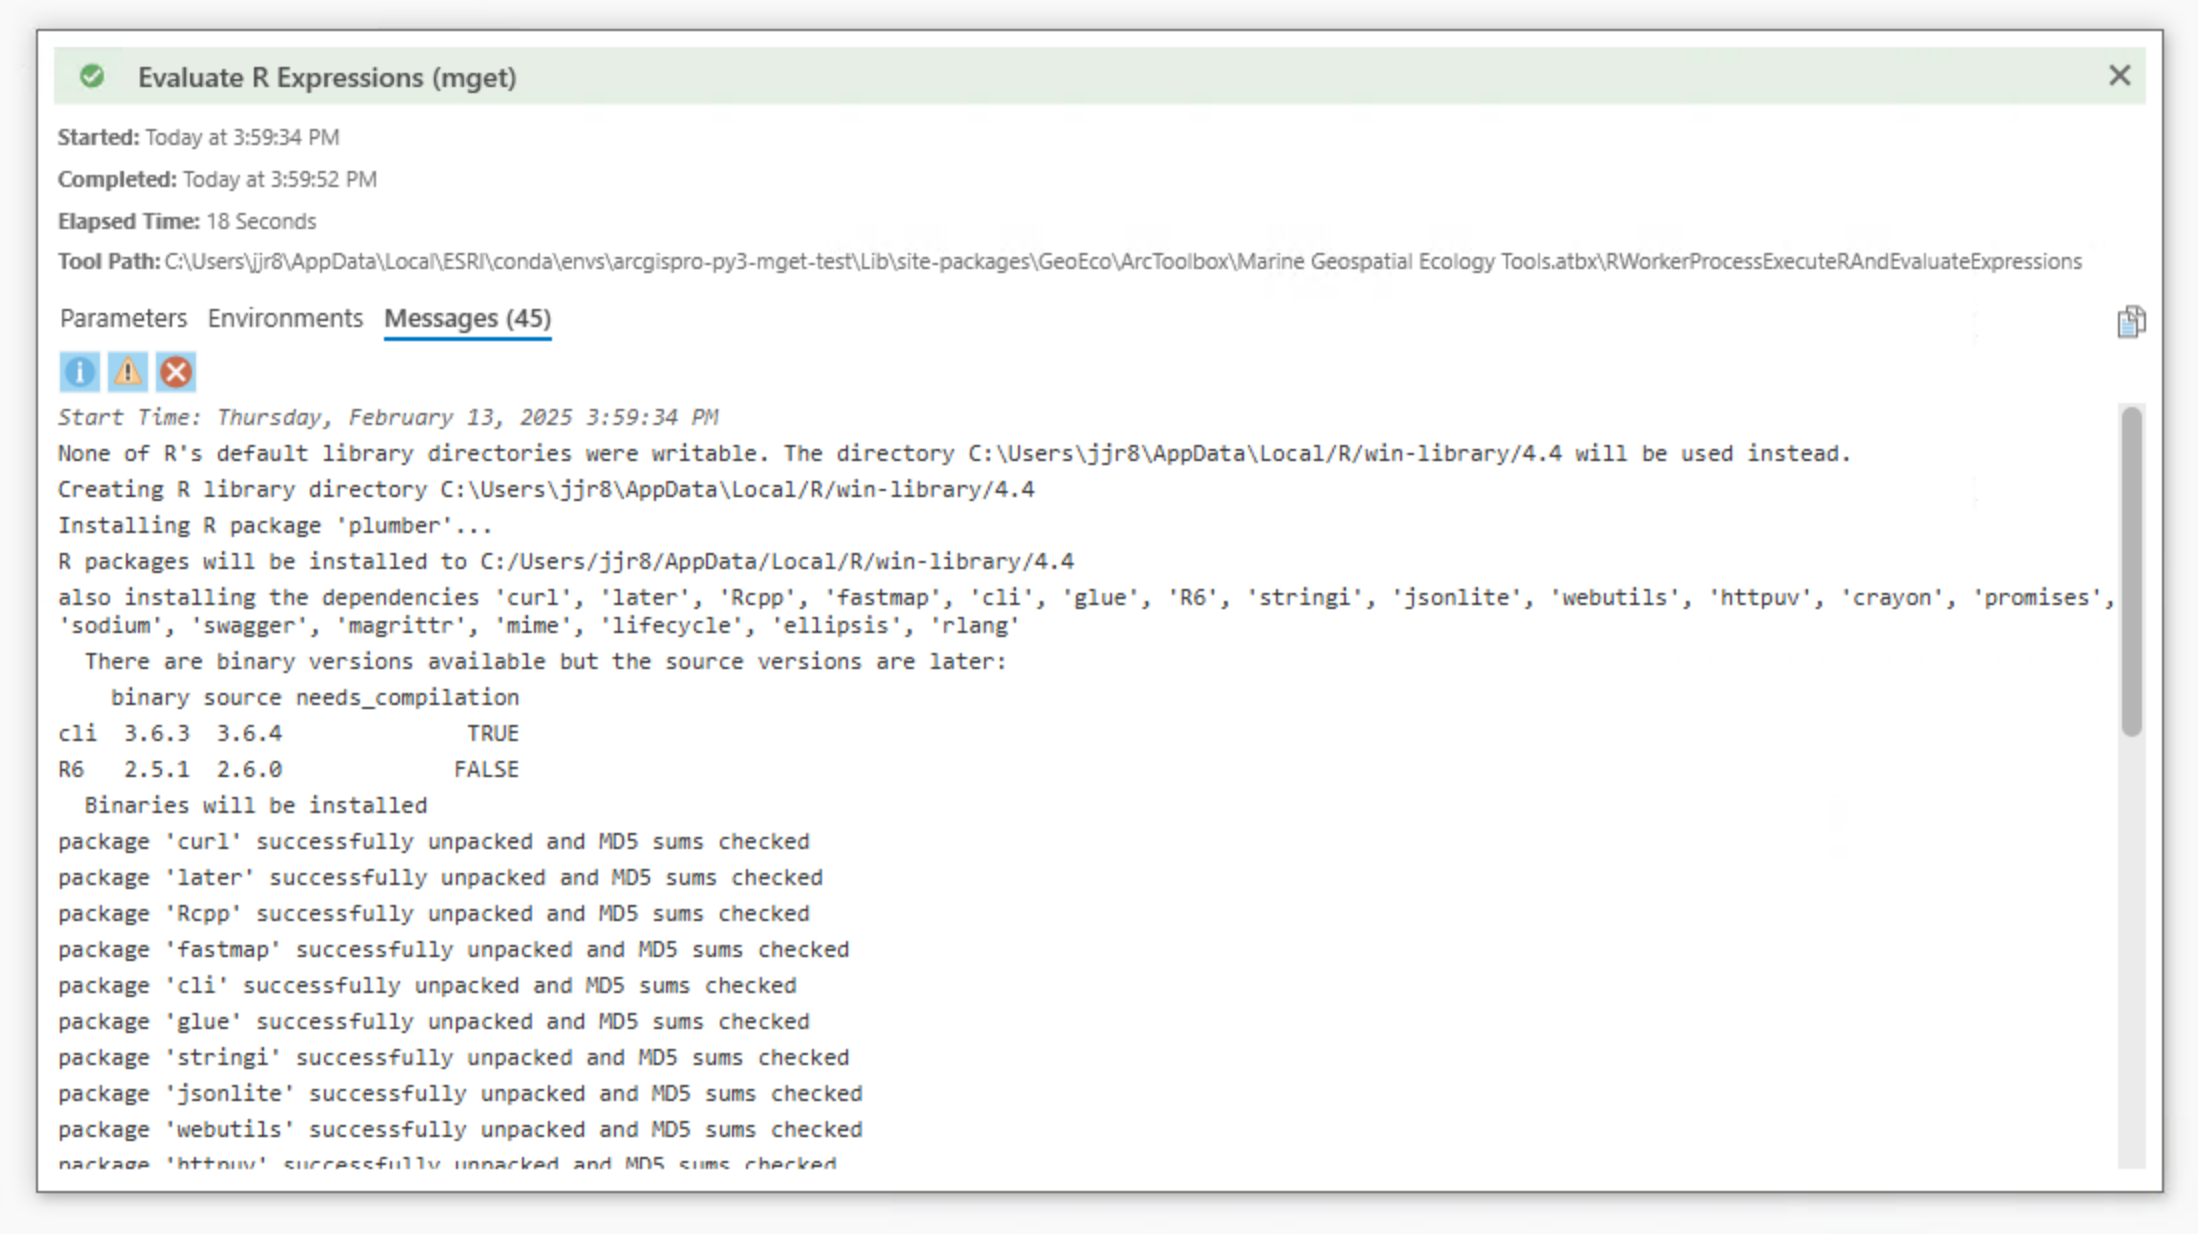
If you scroll down, you’ll see the output from the R print function:
[1] 42. If you click Run and View Details again, it will run much faster and none of the package installation messages will be there: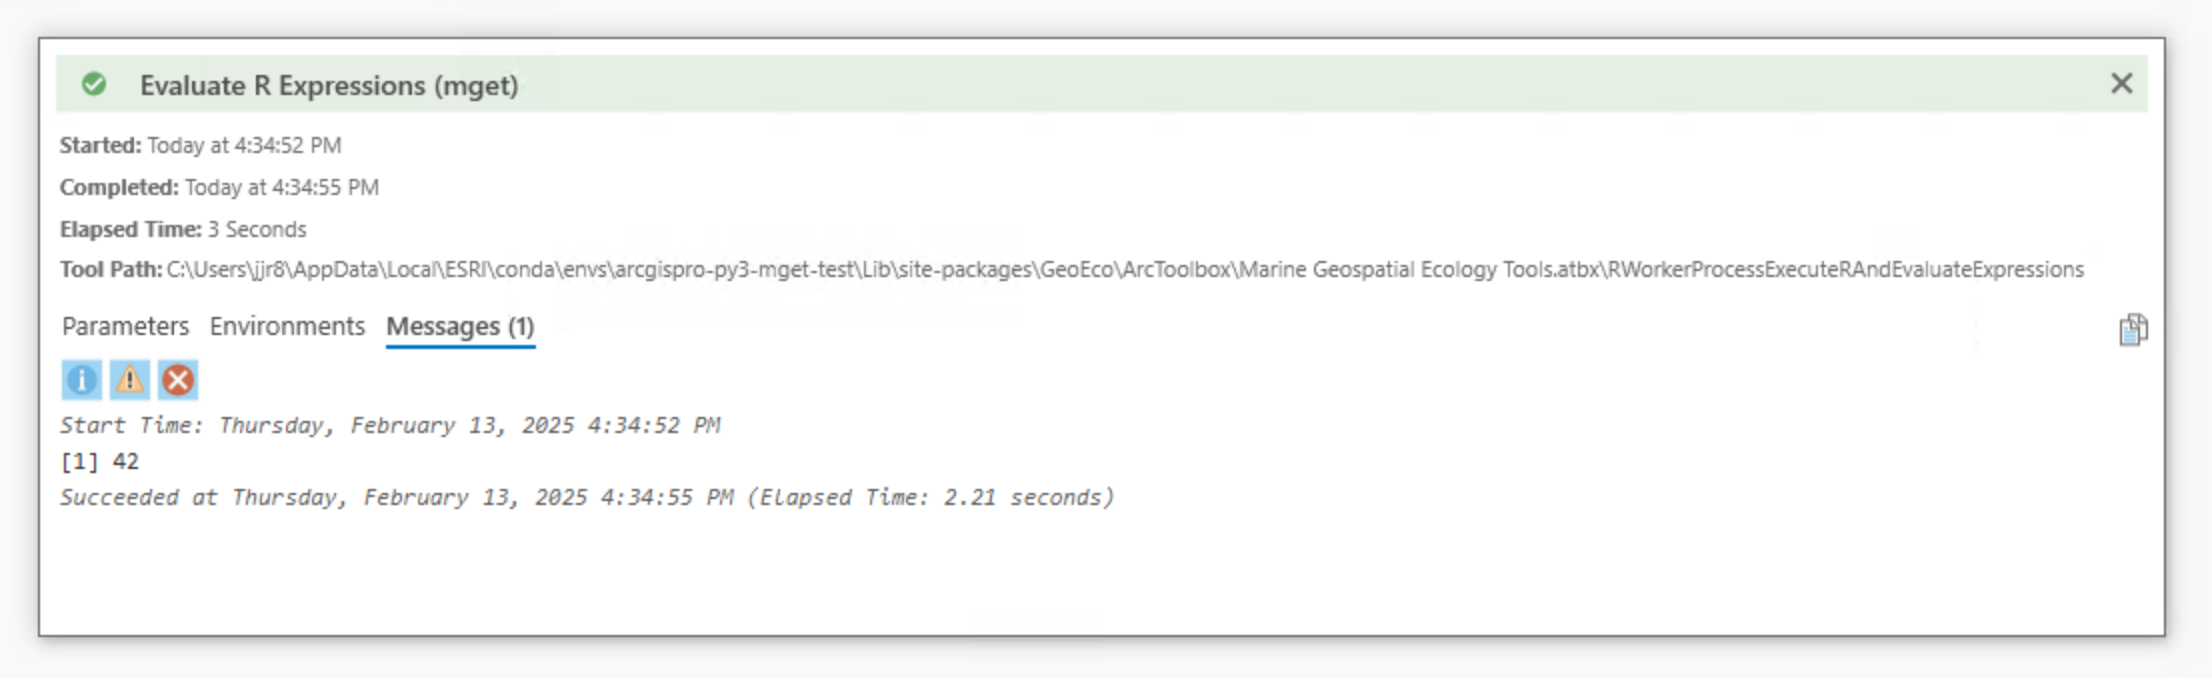
Important
MGET executes R expressions using the Rscript program, which does not have
a graphical user interface. Because of this, R functions like plot()
will not cause anything to appear on the screen. To see plots, you must
save them to a file. The next example illustrates one way to do it.
Running an R script
It can be tedious to type many expressions into the geoprocessing tool’s dialog boxes. Also, it is sometimes convenient for expressions to span multiple lines, but this can’t be done directly in the tool because each text box must contain a complete R expression—it can’t contain just part of one. Because of these limitations, once you need to do more than execute a few trivial expressions, you’ll want to write a script instead with your favorite text editor, and then use the tool to execute the script.
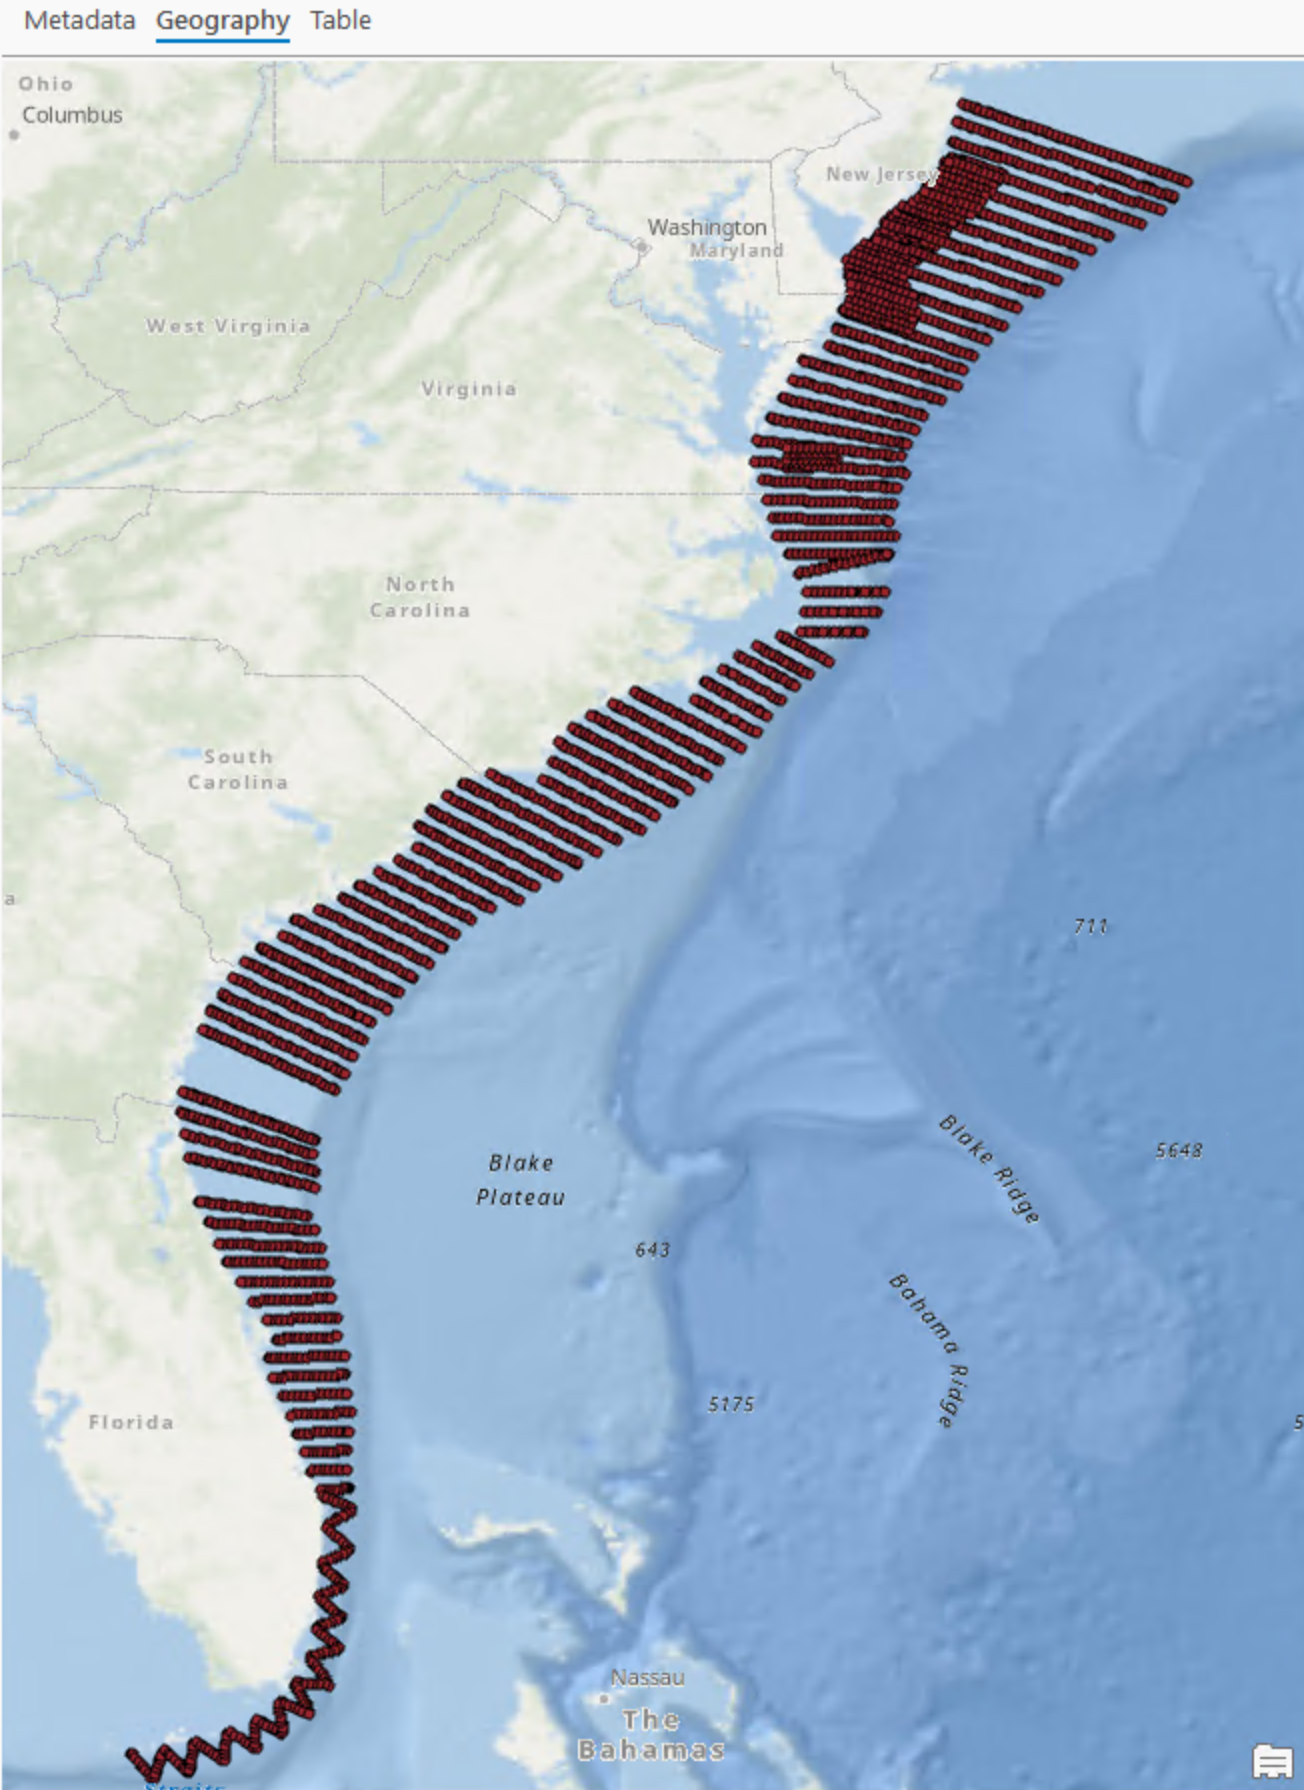
To illustrate this, I wrote a short script to read a feature class and make a
plot, then used the tool to execute the script. Here I had a point feature
class called Survey_608 in a file geodatabase. The points represent the
midpoints of segments of an aerial line-transect survey conducted off the
southeast United States in spring 2012 by the NOAA Southeast Fisheries Science
Center.
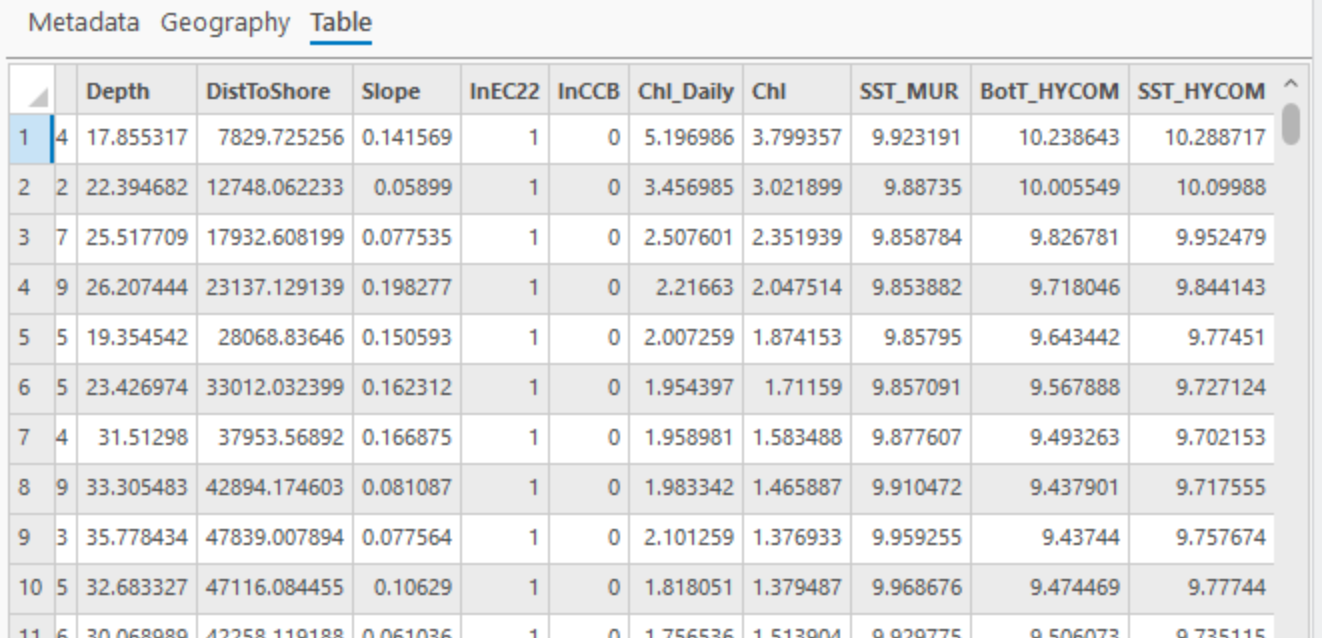
If you’re interested, you can download the original survey data from OBIS-SEAMAP. For this example, I already prepared the original data for analysis by splitting the transects into 5 km segments, excluding segments that had poor survey conditions, computing the centroids of the segments, and sampling a selection of oceanographic data. Here’s part of the attribute table:
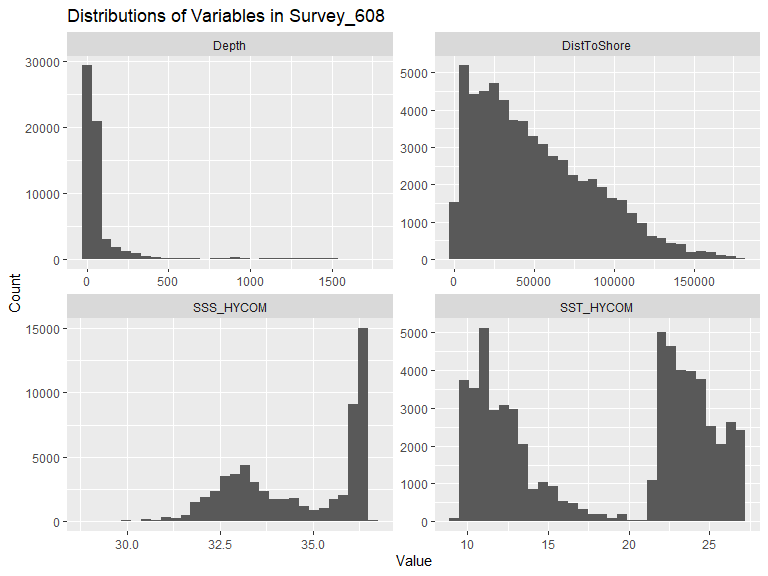
I wanted to create a four-panel plot showing the distributions of four oceanographic variables: Depth, DistToShore, SST_HYCOM and SSS_HYCOM. I wrote the following script to read the feature class with the terra package and create a 4-panel histogram with the ggplot2 package:
# Load the packages we need.

library(dplyr)
library(ggplot2)
library(terra)
library(tidyr)

# Load the feature class and print a summary.

gdbPath <- "C:/Users/jjr8/Documents/ArcGIS/Projects/MGET_R_Example/MGET_R_Example.gdb"
fcName <- "Survey_608"

points <- vect(gdbPath, fcName)
print(summary(points))

# Convert the SpatVector object to a data frame so tidyverse functions can
# work with it, select the columns of interest, drop rows where any variable
# is NA, and pivot the columns of interest to rows, to make ggploting
# easier.

variables <- c("Depth", "DistToShore", "SST_HYCOM", "SSS_HYCOM")

df <- points |>
  as.data.frame() |>
  select(all_of(variables)) |>
  na.omit() |>
  pivot_longer(cols=everything(), names_to="Variable", values_to="Value")

# Write a 4-panel plot to a PNG file named after the feature class.

p <- ggplot(df, aes(x=Value)) +
  geom_histogram(bins=30) +
  facet_wrap(~Variable, scales="free") +
  labs(title=paste0("Distributions of Variables in ", fcName), x="Value", y="Count")

pngPath <- file.path(dirname(gdbPath), paste0(fcName, '.png'))
ggsave(pngPath, plot=p, width=8, height=6, dpi=96)
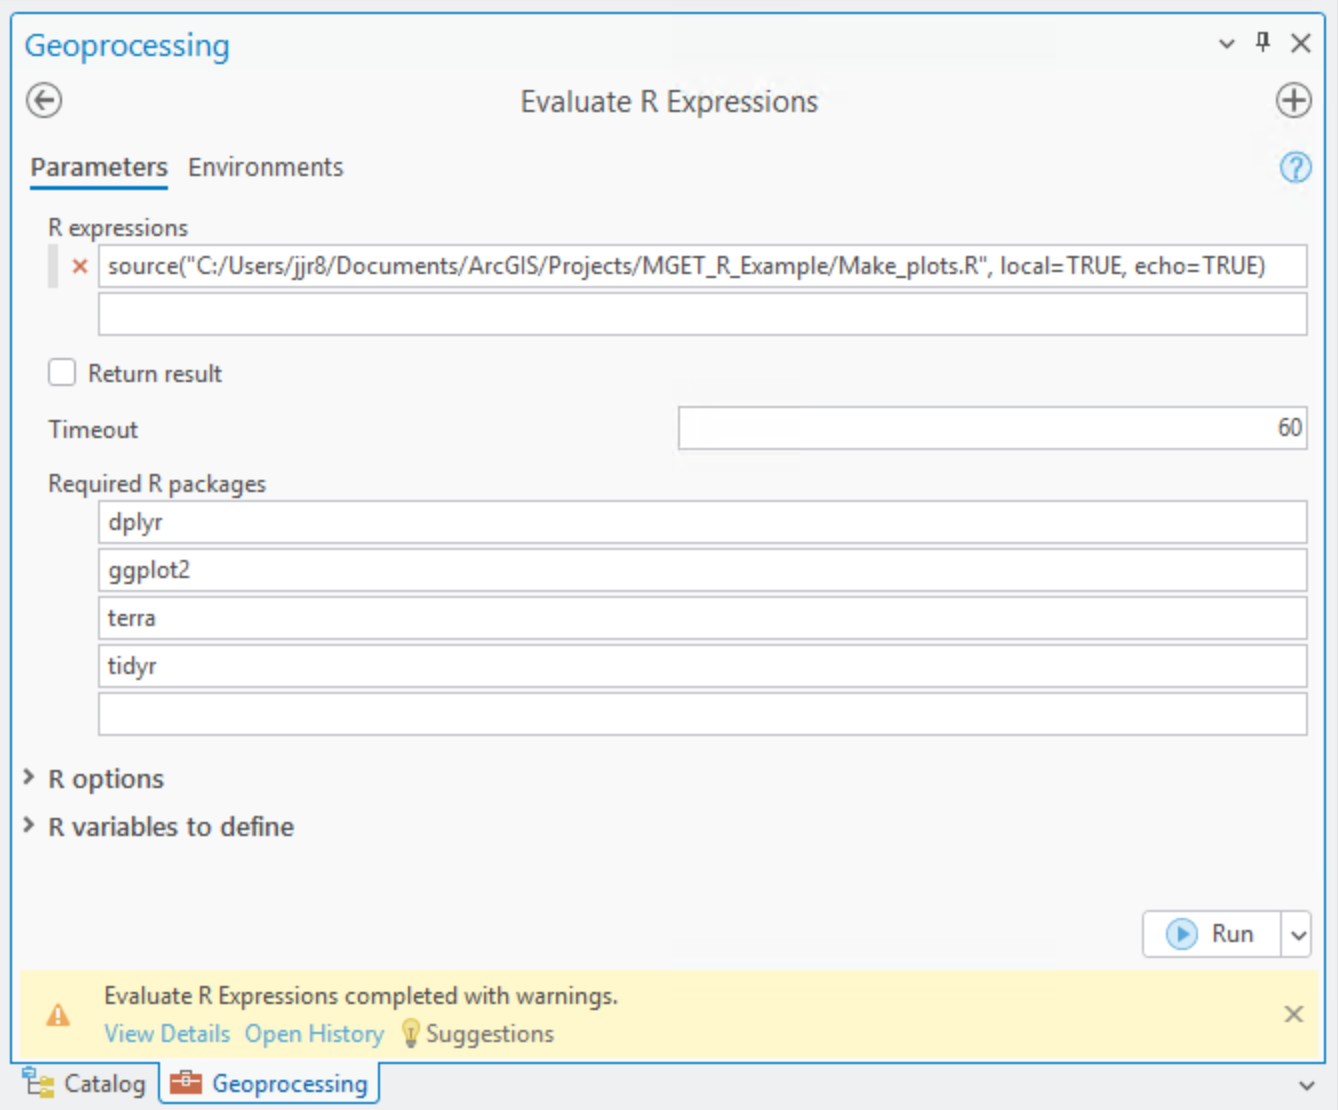
Then, to run it, I used the R source() function to read and execute the
script. I also entered the four packages I needed into the list of Required
R packages:
Important
Be sure to use local=TRUE as a parameter to source(). The
local parameter controls whether or not the script is “sourced” into
the R environment that invoked source() (local=TRUE) or whether it
is sourced into the global environment (local=FALSE, the default).
MGET executes your R expressions in an isolated environment, rather than
the global environment, to try to prevent your code from accidentally
breaking MGET’s R code that manages the communication with Python.
Unfortunately, the source() function operates against the global
environment by default. By specifying local=TRUE, you ensure your code
operates against the isolated environment that MGET created for you.
If you neglect to do this here, chances are you will be fine. But in the next example, we show how to pass in the outputs of geoprocessing tools as R variables. MGET always defines these in the isolated environment. If you then “source” your script into the global environment, it will not be able to access the variables MGET defines for you.
Tip
Include echo=TRUE as a parameter to source() and your script’s
expressions will be logged as they are executed. This let’s you track
progress and quickly identify which line of code failed when R reports an
error.
Here’s the output:
You may have noticed that the Geoprocessing dialog box said “Evaluate R Expressions completed with warnings.” You can see them when you click View Details:
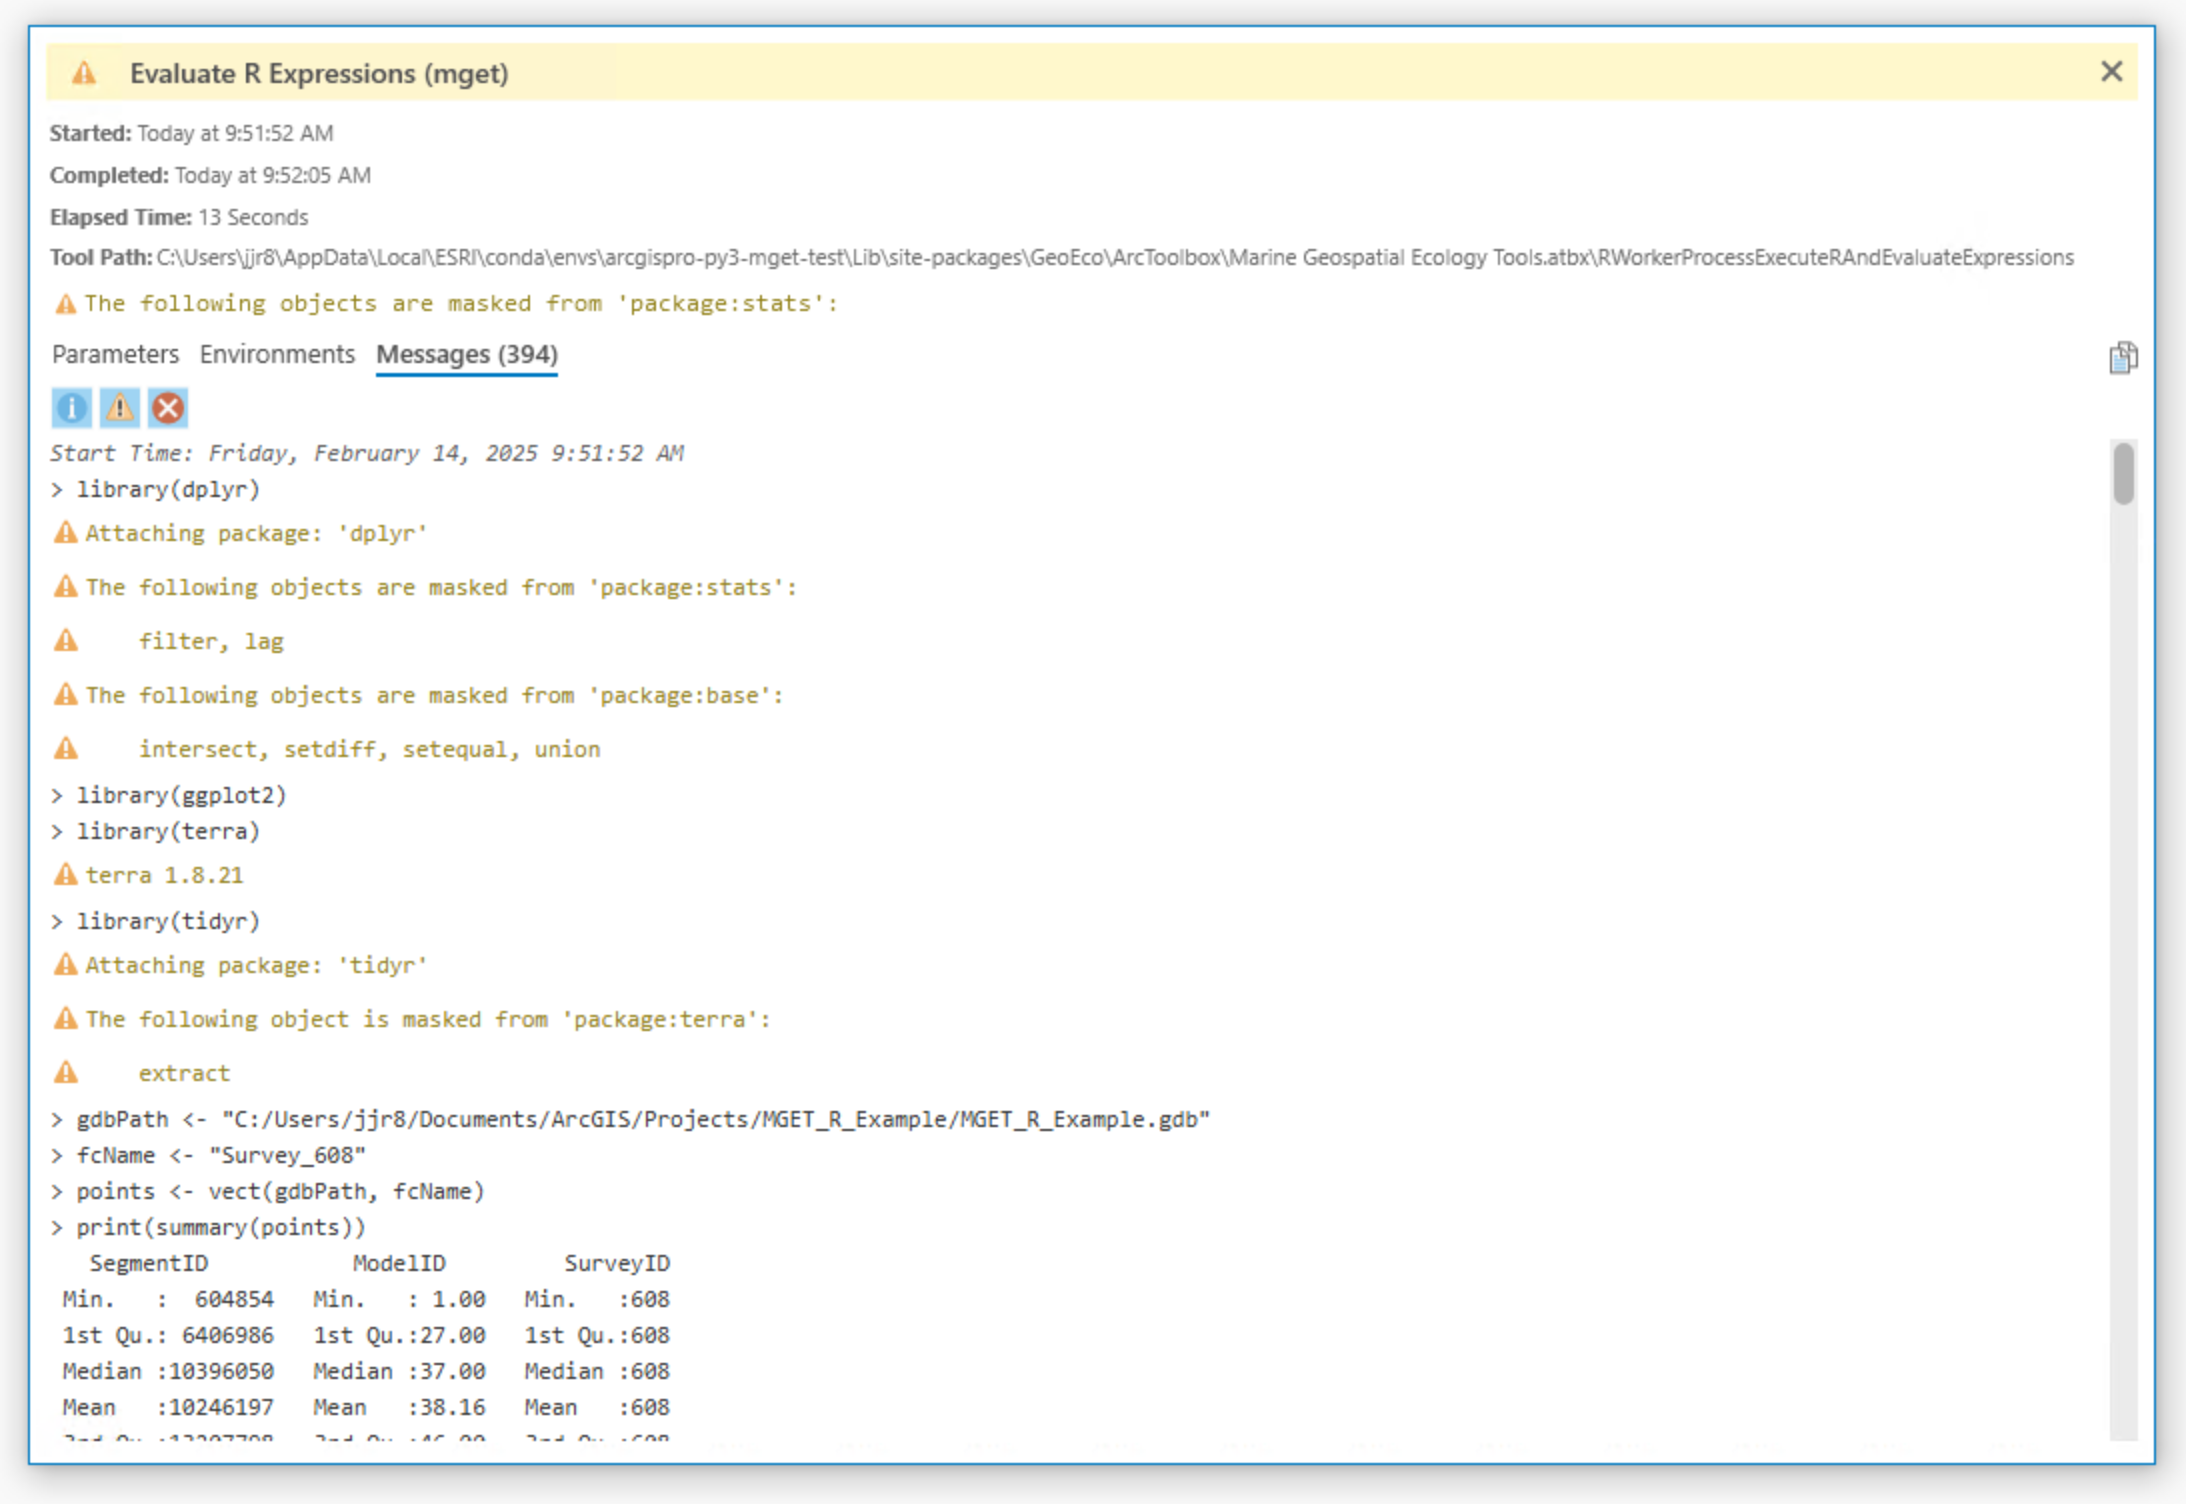
These warnings were all output by the library() functions that loaded the
packages. We can safely ignore these particular messages, which just advise
us of package versions and that one package has functions that have the same
names as a previously loaded package so the previously loaded functions are
“masked”.
Tip
While package loading messages can be useful, they are also regarded as a
regular irritation, to the point that R has a special
suppressPackageStartupMessages() function for suppressing them. To use
it, we can just change this:
library(dplyr)
library(ggplot2)
library(terra)
library(tidyr)
to this:
suppressPackageStartupMessages({
  library(dplyr)
  library(ggplot2)
  library(terra)
  library(tidyr)
})
and all of those warnings will go away, and the tool will complete with a green check-mark rather than a yellow warning triangle.
Passing geoprocessing outputs into the script
To integrate an R script or expressions into a geoprocessing workflow, it can be useful to pass outputs from previous geoprocessing steps into the Evaluate R Expressions tool. To do this, connect the outputs of interest to the Variable values parameter. Then open the tool, go into the R variables to define and enter corresponding names in the Variable names parameter. You must put a name there for each entry that appears in Variable values.
For example, let’s say that after I developed the script above, I wanted to run it on several other feature classes in my geodatabase that had the same columns, in addition to the original one. I decided to use the ArcGIS Iterate Feature Classes iterator like this:
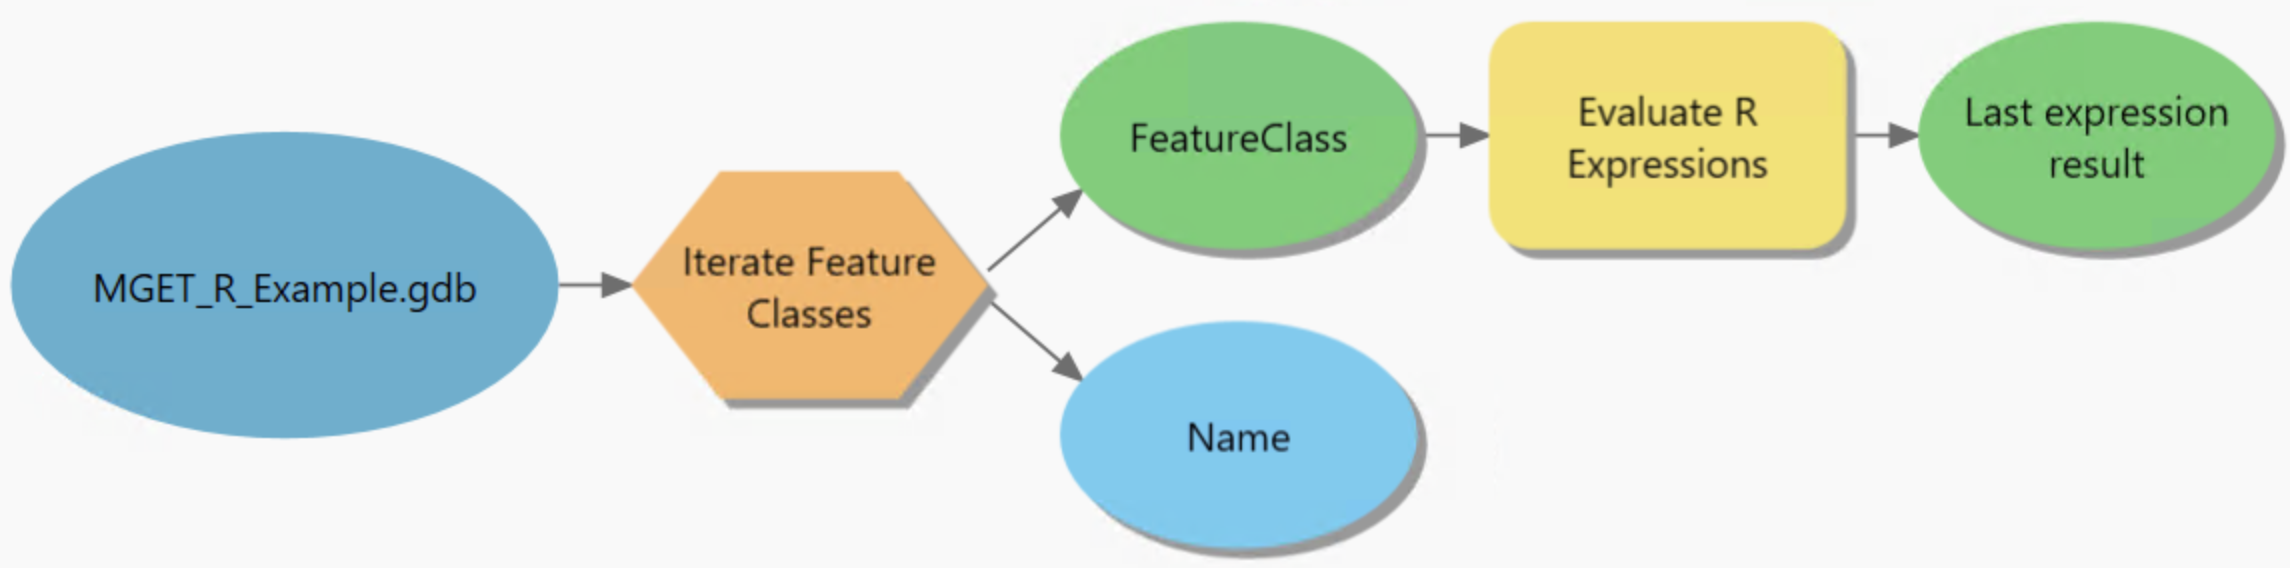
Then, in Evaluate R Expressions, I typed in fcPath for the variable
name:
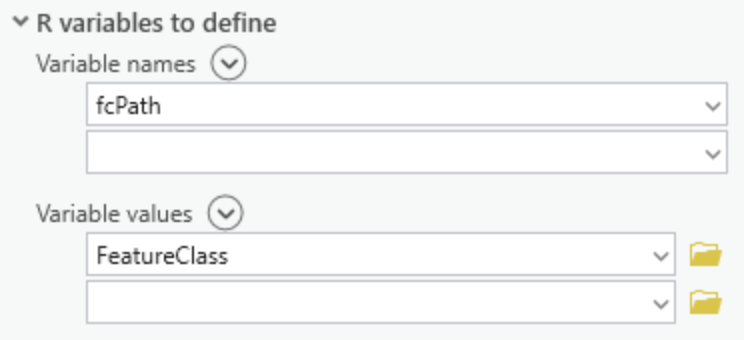
and edited the script to extract the gdbPath and fcName from the
fcPath, which is the full path to the feature class, computed by Iterate
Feature Classes:
# Load the feature class and print a summary.

gdbPath <- dirname(fcPath)
fcName <- basename(fcPath)
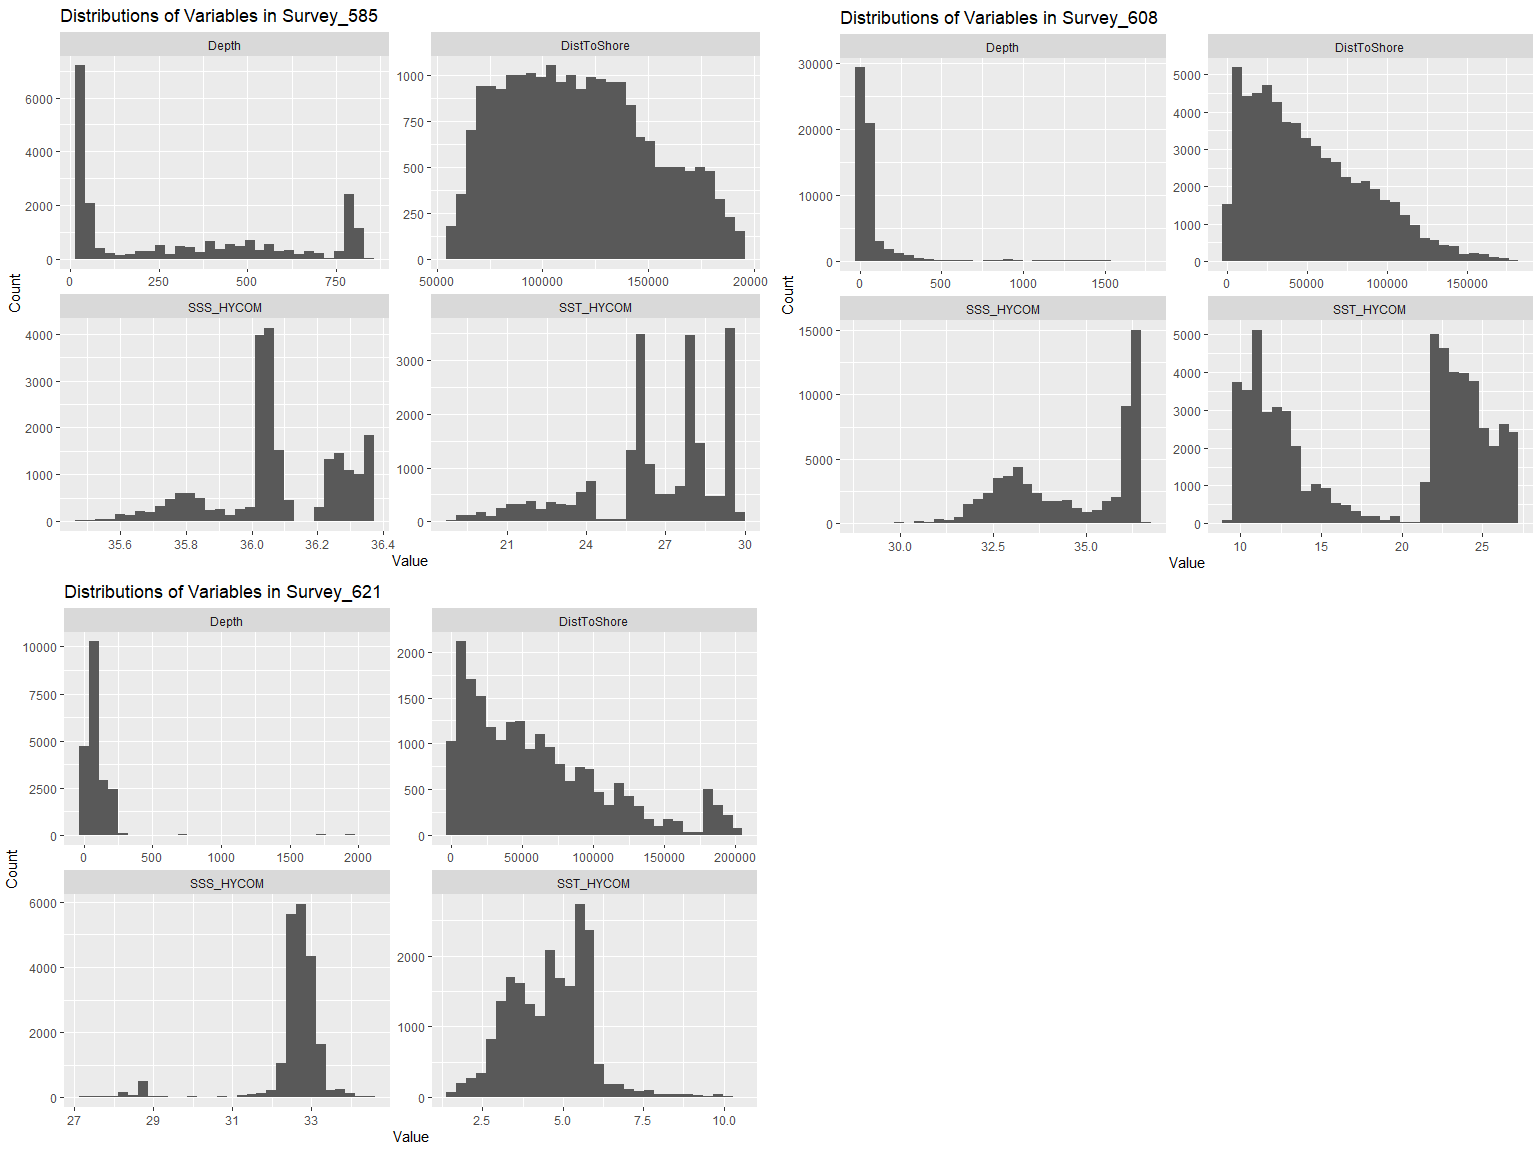
I then ran the workflow. I had three feature classes in my geodatabase; here are the plots generated for each of them, in case you are interested:
Returning a value
If you check the Return result box, Evaluate R Expressions will return
the value of the last R expression to be evaluated, which you can then use in
further geoprocessing steps. For example, I wrote the following script to
calculate the mean of a specified column (columnName) of a specified
feature class (fcPath):
# Load the packages we need.

suppressPackageStartupMessages({
  library(terra)
})

# Load the feature class.

gdbPath <- dirname(fcPath)
fcName <- basename(fcPath)
points <- vect(gdbPath, fcName)

# Calculate the mean of the requested column. Note that the Evaluate R
# Expressions tool returns the value of the last expression that was
# evaluated. In our case, it will be the mean() function (below).

mean(points[[columnName]][[1]], na.rm=TRUE)
Here’s a model showing this script in action:
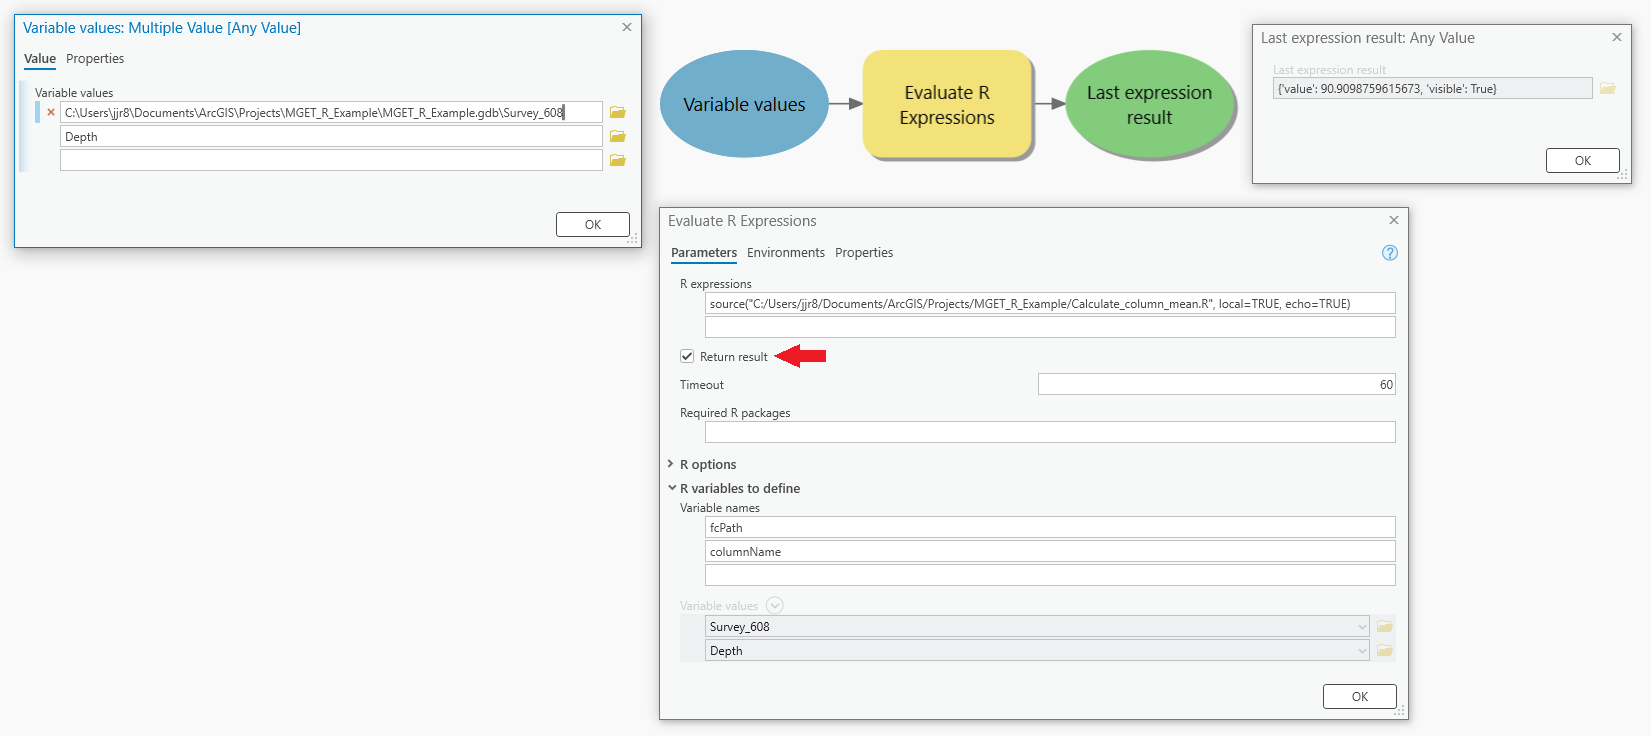
For R expressions, I provided a source() call to run the script. I
then checked the Return result box, highlighted in this screenshot with
the red arrow. For Variable names I provided the two variables we want to
pass in from our model, fcName and columnName. Then, for Variable
values I provided the feature class and the column. (These could have come
as outputs from prior geoprocessing tools, but I’m not illustrating that
here.)
After running the tool, I opened Last expression result and it was set to the floating point value of the mean (at full precision). This could then be used as input to another tool.
As outputs, the tool can successfully return most basic data types as atomic
values, including logical, integer, double, and character.
Vectors of length 2 or more and unnamed R lists will be returned as Python
lists, while named R lists will be returned as Python dictionaries. For more
details of data type conversions, please see the
RWorkerProcess documentation. That said, before returning
complex data types, you should check whether the geoprocessing tool that will
consume those outputs will accept the data types you intend on returning.